FILTERING PACKET CAPTURES
Ever spent hours waiting for a capture to download when all you want is a few MB worth of packets? Or spent hours waiting for Wireshark to load and process a PCAP file ? We certainly have, and it totally sucks ass. Your either running "needle in a haystack" network troubleshooting or deep dive packet analytics. In both cases its more efficient to download only parts of the data for analysis as working with 100GB+ PCAP files can stretch and break many tools.

We`ve been there and done that and decided there is a better way. Our 10G packet capture system provides multiple views of the captured data as internally its a simple highly optimized packet database. You can download it as a single all-in-one mega PCAP, split by 1sec, 10sec, 1min etc or split by 1GB, 10GB, 100GB files as shown below. This multi view approach makes the download and analysis much easier, no fuss, no mess, just drive by and download bite sized PCAP`s into wireshark.
For example, say there is a network problem that requires investigation. You know it happened at ~11:10am in the morning so instead of downloading everything captured until 11:30am you can instead download the 10min sliced PCAP`s at 11:00, 11:10 and 11:20 - no need to grab the entire file or merge hundreds of 1 second PCAP`s.

The above screen shot shows the top level stream directory. In this case its some of our internal regression test captures. There`s a quick link (highlighted in green) to download the entire capture as a single PCAP.
When you click on an individual stream name it shows the list of standard views of that stream (below screenshot). Your not forced to choose only "single PCAP", or only "split by 1sec" etc by the system software. Instead you get all views of the PCAP. The standard views are split every 1 Second, 10 Seconds, 1 Minute, 10Minute, 15 Minute, 1 Hour, 1GB, 10GB, 100GB and 1TB.

The next screenshot below shows the 1 second split view of a captured packet stream. To download a single 1 second PCAP, click on the Wireshark Icon shown in green.

That’s a brief tour of the standard views. Its makes choosing any view of the capture stream easy, and downloading into Wireshark is a breeze! but we`re just getting started...
SIMPLE CUSTOMIZED POST CAPTURE FILTERING
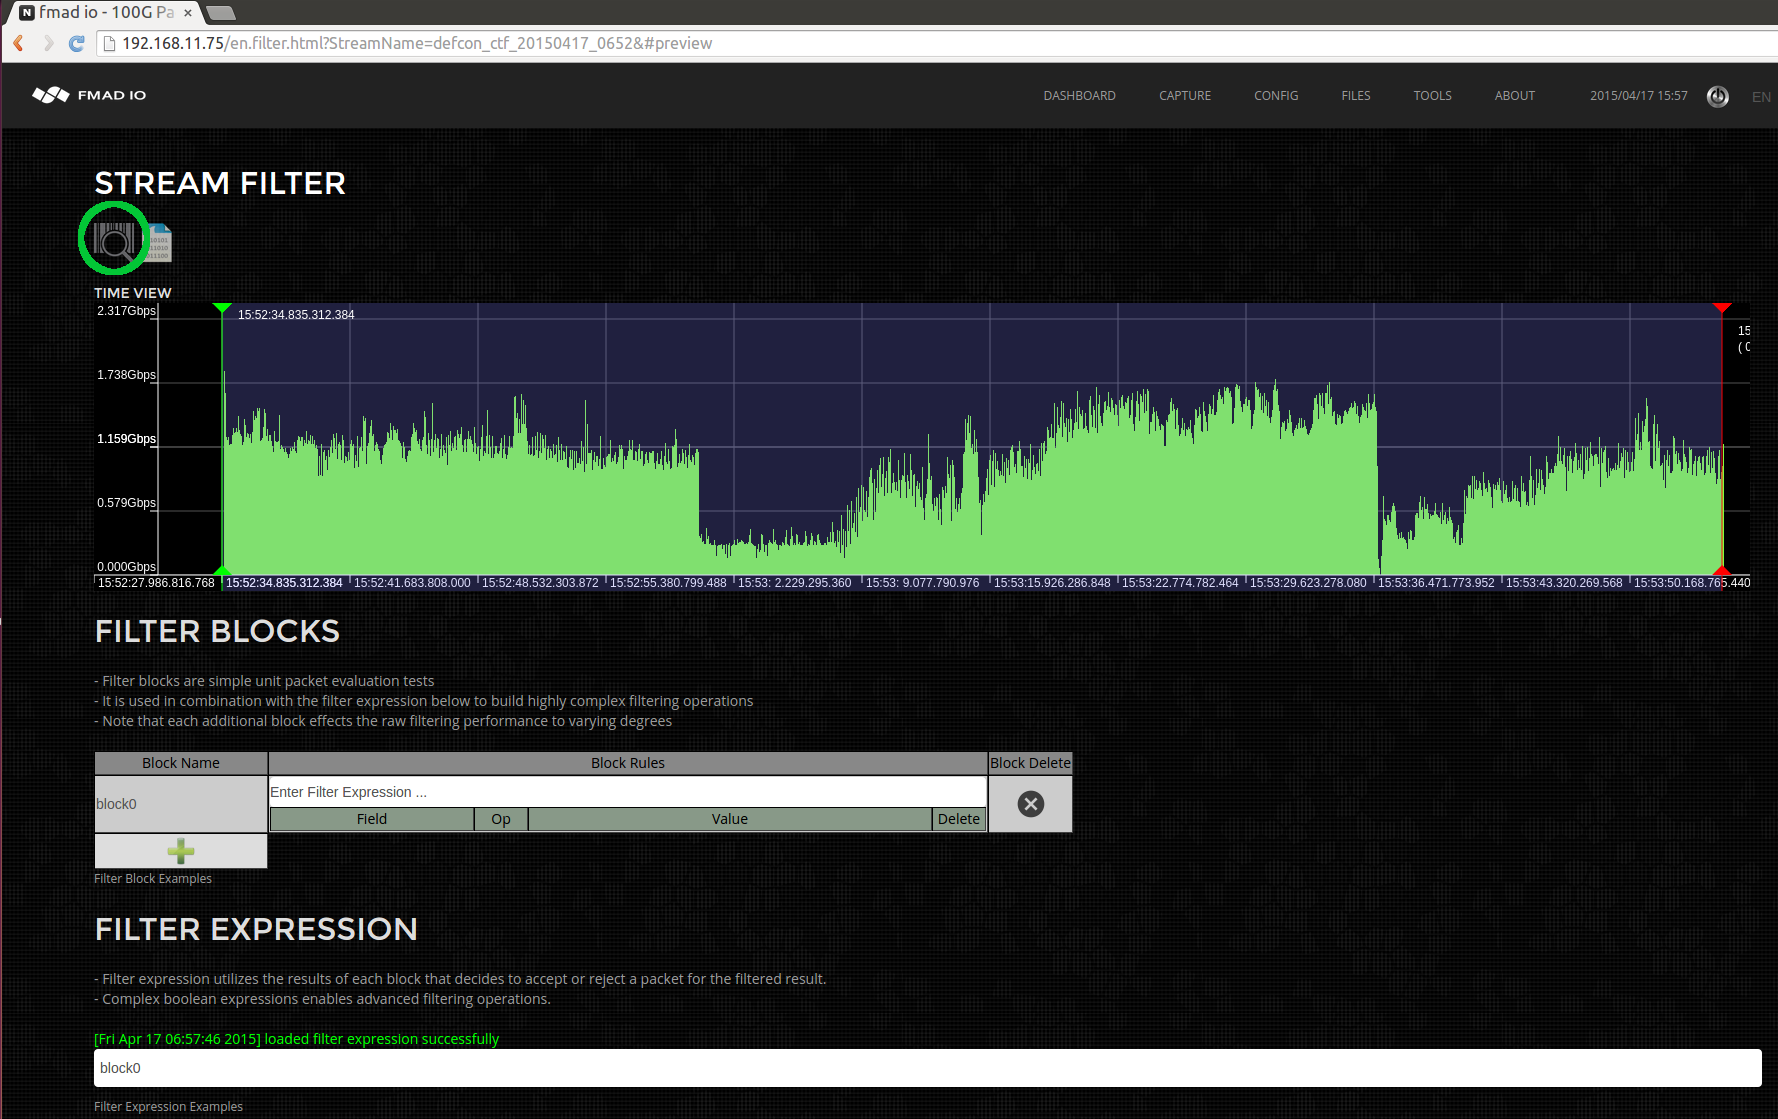
So enough of this pre-determined splits, lets crank up the volume and do something a little more interesting. Starting with the file menu, select the filter button on the stream (highlighted in green) to load the filter page.

Below image is the filter page, it includes a time series plot of the entire capture, filtering options and a histogram. First thing is to run a full parse of the PCAP (button highlighted in green) to get an idea of what the capture contains. As a full DPI parse can take a long time to complete, its not run automatically when the page is loaded.
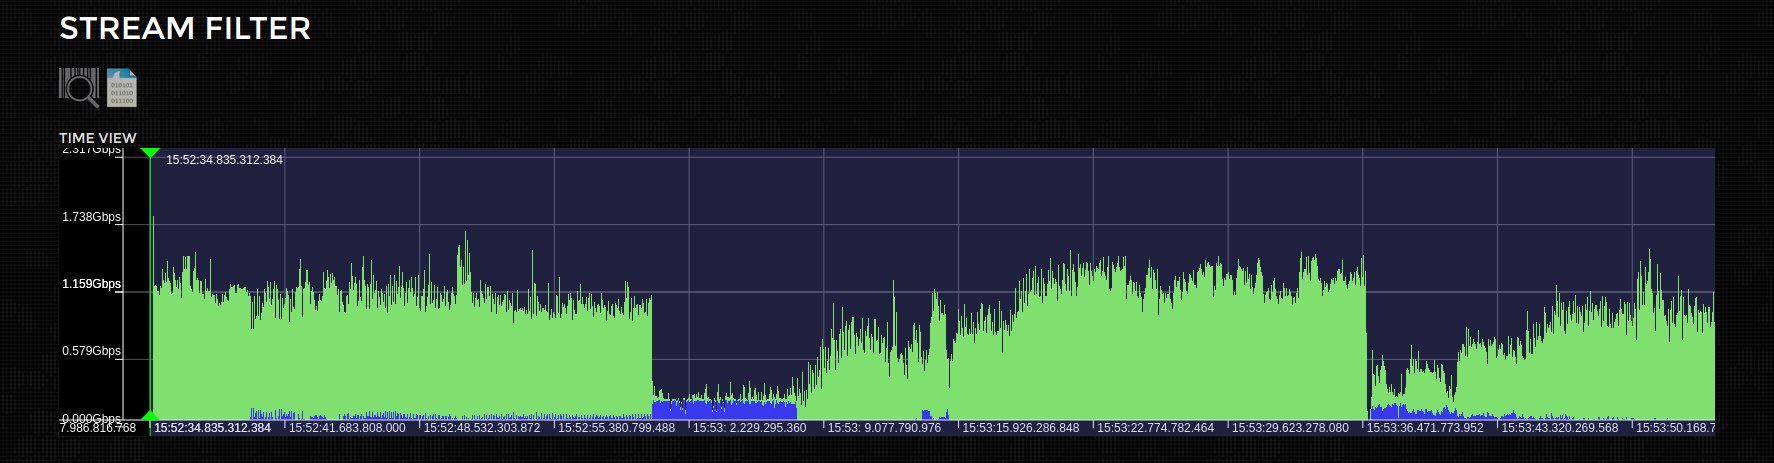
After the parsing has completed, the time series changes color, as seen below.

.. and some basic stream statistics / histograms are shown. We can now see most of the traffic is TCP data (highlighted in green).

So lets select only the UDP traffic, by entering "ipv4.proto == udp" into the filter expression box (highlighted in green below). Its a mini version of wiresharks command bar. Current filter options are on Ether header, IPv4 header, UDP headers, TCP headers and time ranges. Its certainly not a replacement for Wireshark but an acceleration to get the data you want into Wireshark FAST (we process packets at up to @ 15Gbps from disk).

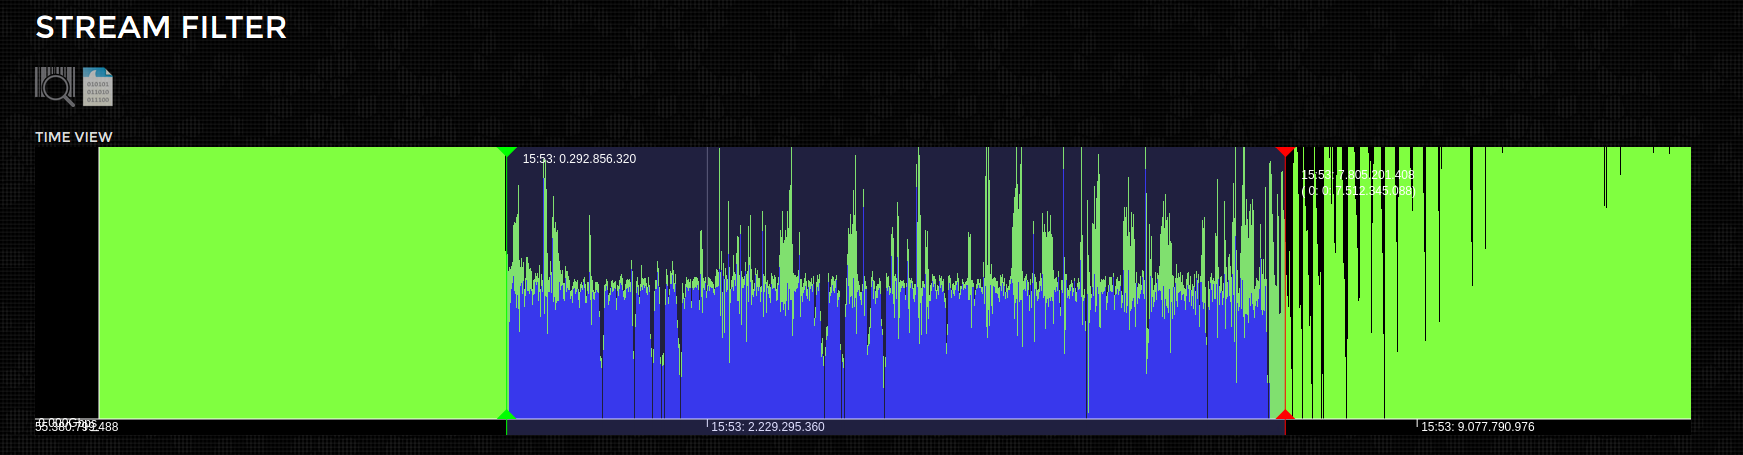
After re-clicking the parse button, the time series view now hilights the packets we`ve selected based on the current filter settings. Its now obvious the traffic pattern changes about half way into the capture. As it appears the TCP traffic has for the most part stopped.
... so lets narrow the time window we`re interested in. Simply move the time select bars (green & red) to the appropriate section of the capture and click the Parse button again (highlighted in green).

You can also zoom in on the time series "Google maps" style, which can be handy when searching for a fine grain control over the time range
Next step is downloading the selected packets into Wireshark. This is simply clicking the download button (highlighted in green). This downloads the filtered PCAP you`ve specified to the local disk. Its extremely quick as only a fraction of the capture is downloaded.

And finally its loaded up into Wireshark and we can see this some kind of DNS based attack!

Its quite a smooth workflow and most importantly you get data into Wireshark quickly. No need to wait around for a download, or even longer for Wireshark to parse the capture. You get the exact packets in all their glory in only a few minutes of bandwidth and work.
Our fmadio 10G packet capture appliance can filter on a wide variety of parameters and we`re always looking for additional settings. Next time we`ll walk through script integration and how to setup an external machine to fetch and filter with a script from a cron job.
... and yes this is another DEFCON CTF competition dataset!