MEASURING SWITCH LATENCY
Ever wondered what latency your switch is running at? Its an often asked question when characterizing SDN devices and also extremely important for everything HFT. It sounds like a simple question, and with our Microburst Analyzer its extremely simple to get answers.

HOW TO MEASURE SWITCH LATENCY
The first problem is how to create an effective test. The best and most accurate way is using fiber + Layer 1 TAP`s + dedicated capture ports. This approach introduces no additional latency as the Packet Capture device is using the exact same beam of light (via the TAP`s) that the switch is sending/receiving. The Setup below shows the network topology to measure the one way switch latency

From the above network topology the primary packet flow looks like:
1) Packets are generated at the bottom left (blue left)
2) Packets received by the switch (orange left)
3) Switch forwards to output port (orange right)
4) Packets received by end point (light blue right)
And the monitoring flow looks like:
a) Inbound Layer 1 50/50 SR fiber optic tap(yellow)
b) Packet Generator packets are passively captured into FMADIO20 Port A
c) Outbound Layer 1 50/50 SR fiber optic tap(yellow)
d) Packet Generator packets are passively captured into FMADIO20 Port B
Thus, every packet to the switch is captured and timestamps on FMADIO20 Port A, and every packet from the swtich is captured and timestamped on FMADIO20 Port B. The downside of this setup is it requires alot of capture ports (read it gets expensive very fast). A simplex line requires 2x10G capture ports and a duplex line requires 4x10G capture ports. Port aggregators can NOT be used because we are testing full line rates thus both Capture port A and B consume the full 20Gbps capture rate.
MICROBURST ANALYSIS SOFTWARE
Hardware setup is only part of the problem, the other half is the analysis. Typically this requires various scripts and handwritten tools to generate meaningful results, but with our microburst analyzer we`ve automated most of the heavy lifting. Once the hardware is setup, we simply start a capture on the FMADIO20 device in the usual way. Then generate 1M 64B packets at line rate and observe the result.
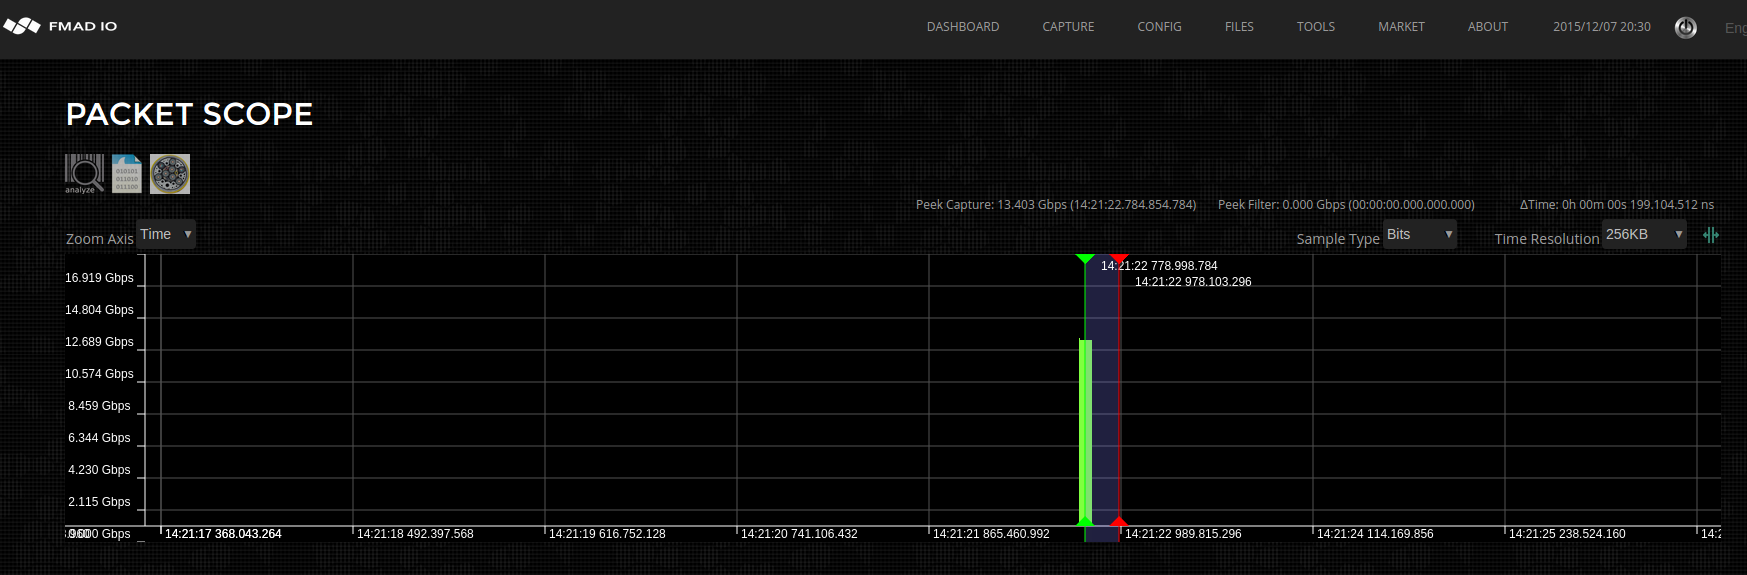
The screenshot above shows our nice 1M packets @ 64B test burst, peeking at ~ 14Gbps (remember this number). Using our "Packet View" feature you can zoom`s all the way down to inspect each and every packet on the wire. It works by sampling about 100msec of data from the location of the current "Green Slider" in the high level Packet Scope window above. The system analyzes this data, extracting all the relevant information, with the result shown below.

Above screenshot shows PacketScope (top window) for selecting the start of the sampling buffer. In this case we`re starting at the very first packet captured. The middle graph shows individual packets plotted against time (X axis). And the bottom table shows net flow information about each packet, enabling selection of individual entries.
You might wonder why the table has 2 blue lines highlighted? Part of the analysis is to find matching packets within the capture. This typically occurs when you have multiple network TAP`s capturing the same packet multiple times, as it traverses your network equipment. In this case we have 2 TAP`s, one before the switch and one after the switch, thus our PCAP contains 2 copies of the same packet.
As shown above, the blue lines highlight packets with the same payload and as expected there are 2 copies of the packet (ingress + egress)

Packet View is fully zoomable, scrollable and more. This enables zooming all the way down to the nanosecond level, you literally see individual packets and bits flowing though the wire. The above screenshot demonstrates clicking on a packet in the Table which selects and highlights the packets in the PacketView window (blue vertical lines + blue packets)
We can see the first packet and second packet, as shown in orange. The table view shows the switch`s ingress/egress packet latency is 1,564 nanoseconds (hilighted in green). Not bad considering it is a very low end 10G switch, also only 2 copies of the packet were found (highlighted in red).
LATENCY ANALYSIS
With our fantastic FMADIO packet capture systems, microburst analysis, latency analysis and packet loss analysis becomes extremely easy. Our software does the raw analysis enabling you to gain insight and literally see individual packets flowing through the wire (its very cool).
Next up we`ll look at packet loss across the switch, and some of the features to automatically detect and analyze the problem.