PACKET ANALYZER
Packet sniffers are great (especially ours :) but a 100TB of packet captures is pretty useless without any tools for analysis. We understand this and are building up a small suite of packet analyzers that anyone can use. Better yet its fully open source on GitHub and starts with a tools to analyze packet latency.
LATENCY FROM 2 DIFF MAC`S
The tool is called pcap_latency_analyzer which calculates latency profiles by searching for the exact same TCP or UDP payload`s in multiple packets and outputting a nice histogram. For example image the following setup.
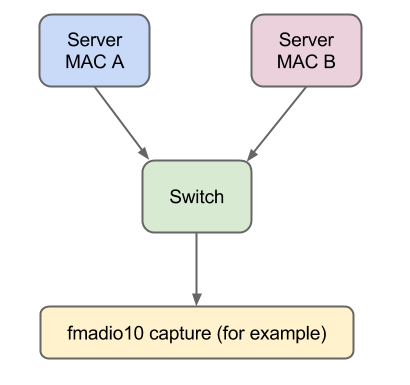
In this case identical payloads are sent by 2 different servers via say UDP to different IP address and ports but end up in the same destination switch. Why duplicates? for redundancy in for example financial markets. Note that this is an over simplification of real environments that is logically equivilent.
The result is a single capture PCAP file, where theres multiples packets with the exact same payload data but with different MAC IP and UDP port numbers. The important question to ask is: which server`s packet arrives first?
Using pcap_latency_analyzer tool its easy, all you need is the two MAC address of the servers and run with the following commands
pcap_latency_analyzer ./10g-packet-sniffer.pcap --udp-only --mac-diff --mac-diff-a 00:11:11:11:11:11
--mac-diff-b 00:22:22:22:22:22 --latnecy-histo-unit 250
.
.
[snip]
.
.
4250 ns .: 0.0096 (0.0179) : *
4500 ns .: 0.0110 (0.0185) : *
4750 ns .: 0.0116 (0.0191) : *
5000 ns .: 0.0135 (0.0198) : *
5250 ns .: 0.0181 (0.0207) : *
5500 ns .: 0.0236 (0.0219) : *
5750 ns .: 0.0316 (0.0235) : *
6000 ns .: 0.0456 (0.0259) : **
6250 ns .: 0.0630 (0.0292) : ***
6500 ns .: 0.0915 (0.0339) : ****
6750 ns .: 0.1268 (0.0405) : ******
7000 ns .: 0.1666 (0.0491) : ********
7250 ns .: 0.2197 (0.0605) : **********
7500 ns .: 0.2785 (0.0749) : *************
7750 ns .: 0.3241 (0.0917) : ****************
8000 ns .: 0.4412 (0.1145) : **********************
8250 ns .: 0.4987 (0.1403) : ************************
8500 ns .: 0.5676 (0.1697) : ****************************
8750 ns .: 0.6720 (0.2045) : *********************************
9000 ns .: 0.7260 (0.2421) : ************************************
9250 ns .: 0.7897 (0.2829) : ***************************************
9500 ns .: 0.8655 (0.3277) : *******************************************
9750 ns .: 0.9083 (0.3748) : *********************************************
10000 ns : 0.9453 (0.4237) : ***********************************************
10250 ns : 0.9856 (0.4747) : *************************************************
10500 ns : 1.0000 (0.5265) : **************************************************
10750 ns : 0.9965 (0.5780) : *************************************************
11000 ns : 0.9725 (0.6284) : ************************************************
11250 ns : 0.9308 (0.6766) : **********************************************
11500 ns : 0.8725 (0.7217) : *******************************************
11750 ns : 0.7933 (0.7628) : ***************************************
12000 ns : 0.6989 (0.7990) : **********************************
12250 ns : 0.5962 (0.8298) : *****************************
12500 ns : 0.4937 (0.8554) : ************************
12750 ns : 0.4075 (0.8765) : ********************
13000 ns : 0.3278 (0.8934) : ****************
13250 ns : 0.2598 (0.9069) : ************
13500 ns : 0.2029 (0.9174) : **********
13750 ns : 0.1615 (0.9258) : ********
14000 ns : 0.1255 (0.9322) : ******
14250 ns : 0.0994 (0.9374) : ****
14500 ns : 0.0804 (0.9416) : ****
14750 ns : 0.0644 (0.9449) : ***
15000 ns : 0.0542 (0.9477) : **
15250 ns : 0.0439 (0.9500) : **
15500 ns : 0.0374 (0.9519) : *
... and you get a nice histogram of the time delta between the two servers (or switch's). From this its pretty clear server B is sending the same data after server A by around 10.5usec! If the histogram is noisy you can packet scrub it further by sampling UDP packets of a specific length via the --udp-length option.
LATENCY ANALYSIS OF 2 PCAPS
Imagine the following setup. It might seem a bit strange to capture the exact same data with two different machines but its more common than you think. For example if a HFT firm has 2 separate brokers with two completely independent rack`s, you want to know which brokers infrastructure is better by comparing when the market data arrives. Thus after purchasing 2 10g network sniffers (from us of course!) for both rack`s you are now capturing the same market data from one source (the exchange) but in two different locations, with slightly different infrastructure (again logical simplification of real network environments).
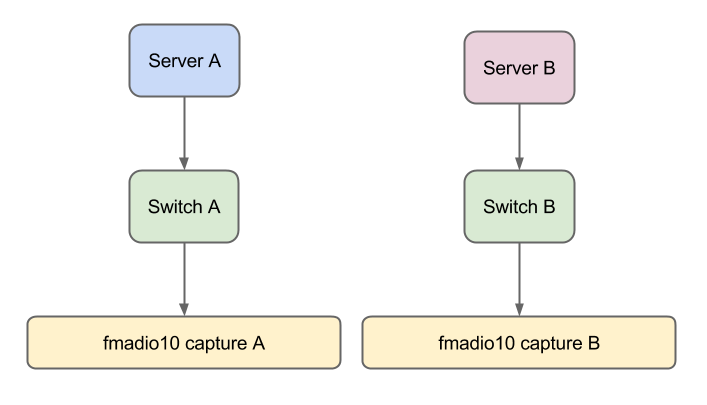
The only catch here is both packet sniffers need extremely accurate time synchronization. For example our fmadio 10G packet sniffer supports PTPv2, PTPv2 + PPS and under 10ns GPS 1PPS for this very purpose! In practice we typically see sub 50-100ns world time accuracy, thats pretty dam good.
To run the analysis and compare two different PCAP files payloads, use the following options
pacp_diff --file-diff-udp-only --latency-histo --latency-histo-unit 100 ./fmadio-10g-capture-A.pcap
./fmadio-10g-capture-B.pcap
.
.
[snip]
.
.

6200 .ns : 0.0001 (0.0000) : *
6300 .ns : 0.0011 (0.0001) : *
6400 .ns : 0.0032 (0.0004) : *
6500 .ns : 0.0117 (0.0014) : *
6600 .ns : 0.0387 (0.0046) : *
6700 .ns : 0.0743 (0.0108) : ***
6800 .ns : 0.1198 (0.0209) : *****
6900 .ns : 0.1522 (0.0337) : *******
7000 .ns : 0.2156 (0.0518) : **********
7100 .ns : 0.2956 (0.0766) : **************
7200 .ns : 0.3748 (0.1081) : ******************
7300 .ns : 0.4784 (0.1482) : ***********************
7400 .ns : 0.5714 (0.1962) : ****************************
7500 .ns : 0.7193 (0.2566) : ***********************************
7600 .ns : 0.8366 (0.3268) : *****************************************
7700 .ns : 0.8878 (0.4014) : ********************************************
7800 .ns : 0.9444 (0.4807) : ***********************************************
7900 .ns : 0.9624 (0.5615) : ************************************************
8000 .ns : 1.0000 (0.6454) : **************************************************
8100 .ns : 0.8957 (0.7206) : ********************************************
8200 .ns : 0.7725 (0.7855) : **************************************
8300 .ns : 0.7094 (0.8450) : ***********************************
8400 .ns : 0.5818 (0.8939) : *****************************
9500 .ns : 0.4292 (0.9299) : *********************
9600 .ns : 0.2947 (0.9547) : **************
9600 .ns : 0.2090 (0.9722) : **********
9700 .ns : 0.1325 (0.9833) : ******
9800 .ns : 0.0853 (0.9905) : ****
9900 .ns : 0.0576 (0.9953) : **
10000 ns : 0.0287 (0.9977) : *
10100 ns : 0.0141 (0.9989) : *
10200 ns : 0.0046 (0.9993) : *
10300 ns : 0.0036 (0.9996) : *
10400 ns : 0.0025 (0.9998) : *
10500 ns : 0.0015 (1.0000) : *
10600 ns : 0.0005 (1.0000) : *
10700 ns : 0.0000 (1.0000) : *
... which looks like capture A is about 7,900ns faster than capture B. Which may be the difference of an extra hop and one switch vendor over the other.
There`s alot more you can do with the pcap_latency_analyzer packet analyzer and the code is constantly evolving. Get it now on github packet latency analyzer full source so send us your patches!