TOUR OF OUR NETWORK CAPTURE SYSTEM
We`ve spent a fair amount of time talking about our capture hardware so lets switch gears and dig into the software interface. Interaction with our 10G, 40G and 100G ethernet capture systems is over HTTP or HTTPS. You can use a web browser on port 80 or CURL and HTTPS on port 1337, its completely configurable and only uses a single TCP port. Alternatively there is also a WebDAV interface if your deep in the colo and without a browser.

THE DASHBOARD
The first page is always the dashboard, where all critical information about the system is on a single page. It enables a quick check on multiple levels about the health of the system. Top half of the page is seen below.

You can see current capture bandwidth, in this case its a synthetic test of sustained 40Gbps packets. And just as important is the current disk write bandwidth (in purple) which matches the capture rate. It also shows the read bandwidth (in orange). All graphs have a scrollable / zoom-able component.
Also note on all pages there is a capture enable icon in the menu tool bar (top left hand corner) which shows if the device is currently capturing or not. This is helpful when there is little/no capture traffic to check the devices capture status. Next up is the capture fpga device temperature, as pictured below.

In the above picture its clear when a capture has started, as the Capture FPGA device`s temperature jumps to a little over 40 C. You can also trends such as the temperature slowly drifting upward. This is because the device was on an office table and not the thermally controlled environment of a data center.
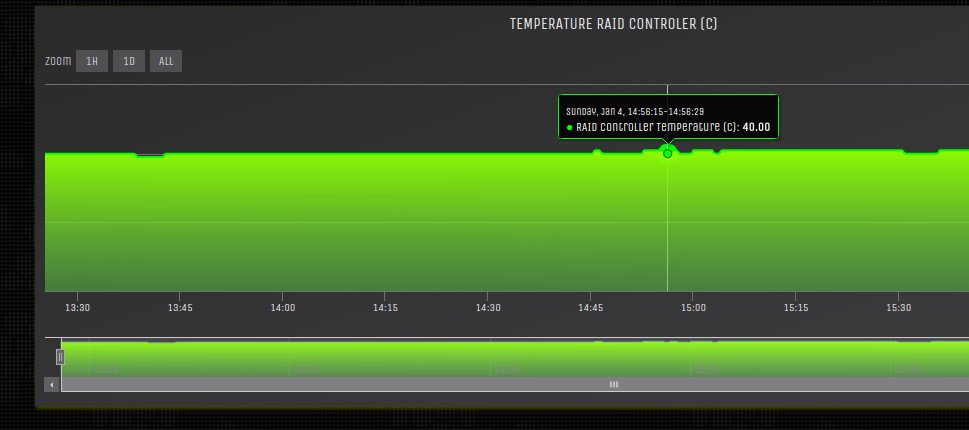
RAID controllers temperature is seen in the above picture. Using the mouse you can sample the temperature at each point.
And SSD temperature ranges are seen in the graph below. Its a temperature range as there are 16 to 32 individual SSD drives in the system thus it shows the minimum temp and maximum temp of all the disks.

As you can see the SSD`s are running quite cool, even tho its in a warm office environment.
The dashboard is still a work in progress with this as a start. If you need anything specific we are more than happy to include additional information.
CAPTURE CONFIG
Quick and easy capture configuration is critical. We have simplified both immediate capture and scheduled capture to its bare essentials with a very simple and clean interface seen below.
QUICK CAPTURE
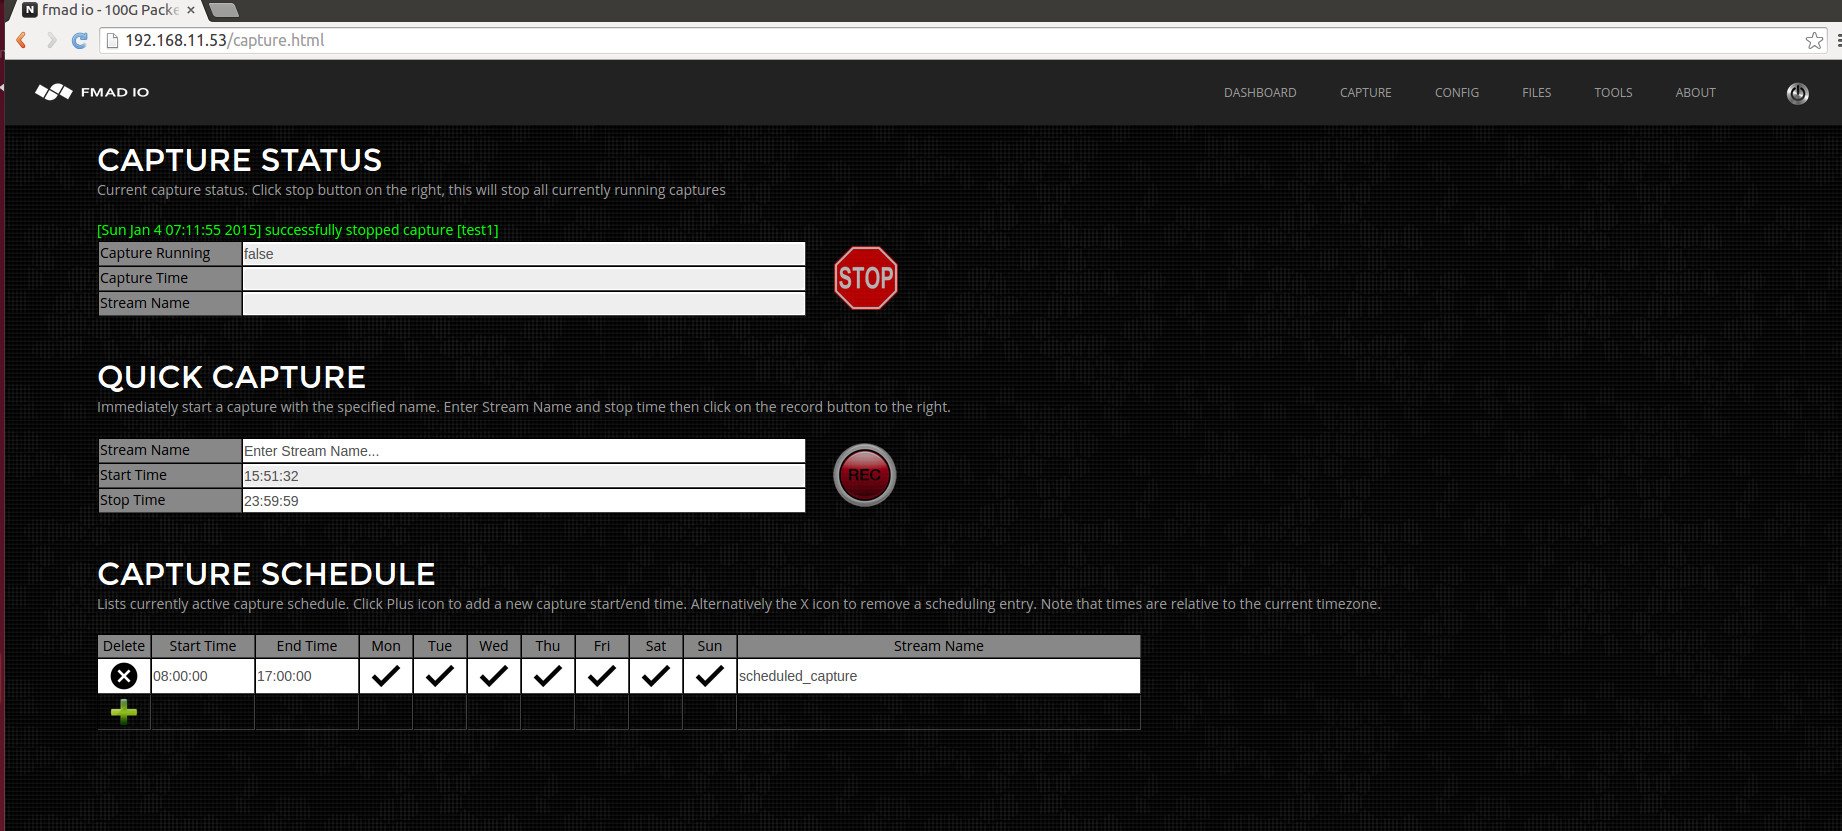
The above picture is described as follows. Capture Status - shows the current status. Quick Capture, this starts a capture immediately. Capture Schedule, is for scheduling captures at specific times and days of the week.
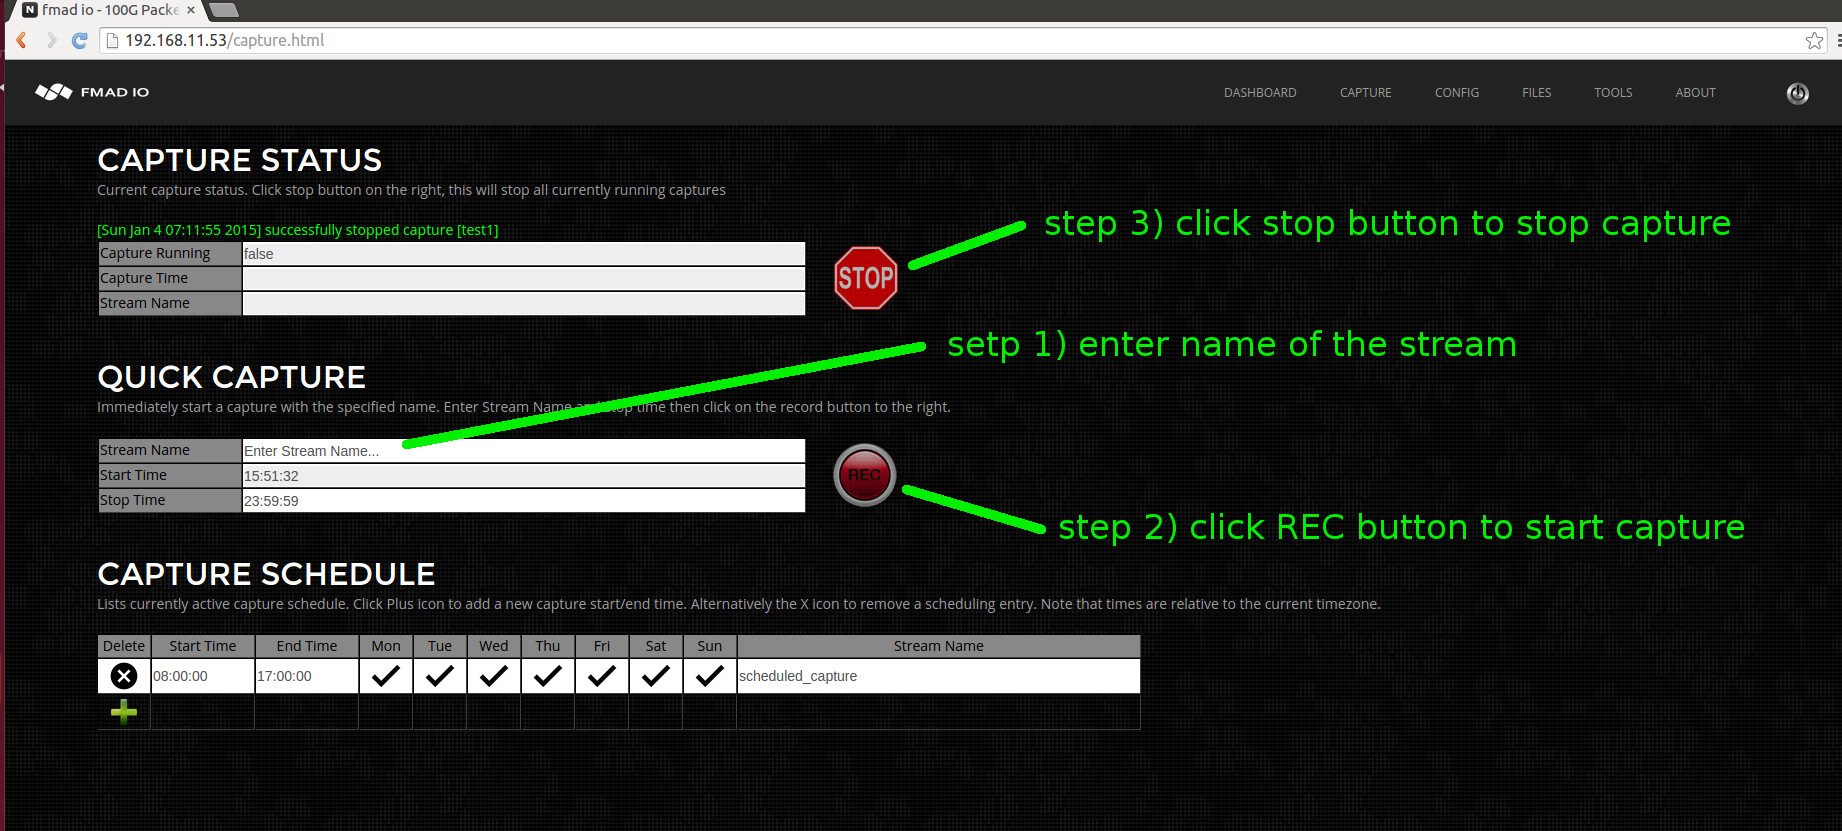
Starting a capture immediately is very easy with two steps shown below. Step 1) enter a name of the capture stream. Step 2) click record. Simple as that. When you want to stop the capture, click the stop button.
But what about the file format to write ? or what about slice by seconds, slice by GB and options ? Our capture system is more like a crazy ass mother of a packet database. With the philosophy of capture everything, filter later - courtesy of the NSA... The files download from the system are all dynamically generated so you can sort and filter to get the exact packets you need, in what ever format you want! More on that later.
SCHEDULED CAPTURE
Scheduled captures are more likely how the device will be running day-to-day. The interface is also quite simple, with all fields editable at any time. The process is shown below.

To create a new scheduled capture, step 1) "+" icon creates a new row in the capture scheduler. step 2) set the start/stop time in 24 hour HH:MM:SS format in the current timezone. step 3) toggle each day of the week to enable/disable the capture. step 4) set a stream name to identify the capture.
Its quite simple with status updates and helpful feedback by the system throughout the process.
PCAP FILES
In other systems your either locked to a 1 second / 1GB split / single file for an entire capture and sometimes the whole system. This simply flat out sucks dogs balls. There`s no other way to describe it. It makes your job more difficult and slows down complex network debug sessions. Internally fmadio capture systems are a 4TB to 32TB packet database that has raw read bandwidth of 50Gbit to 100Gbit/second. Thus with efficient and well designed code you can easily fetch / filter and frame PCAP`s on demand, based on your request, and vastly speed up your network debug session.
WASTING HOURS DOWNLOADING PCAPS FROM CAPTURE DEVICE?
WASTING HOURS WAITING FOR WIRESHARK TO FINISH ?
Have you ever spent hours waiting for a PCAP to download from the capture device? Or spent hours waiting for Wireshark to finish processing ? It sucks. Our systems provide all views of a network capture stream enabling you to effortlessly cherry pick the packets you want, so the data gets into your local machine quickly and wireshark slices packets like a hot knife through butter.
Our top level stream/file view lists all captured streams on the device, as pictured below. You can see there are 3 streams here, test1 and two defcon22_ctf stream names. There`s a quick link for grabbing the entire stream as a single PCAP and a quick link to start the filter engine.

Clicking on the stream name drills down to the standard time and file size slicing of the capture, as pictured below.

The standard splits are the following:
Single PCAP
Split every 1 Second
Split every 10 Second
Split every 1 Minute
Split every 10 Minutes
Split every 15 Minutes
Split every 1 Hour
Split every 1GB
Split every 10GB
Split every 100GB
Split every 1TB
.. and clicking on say the 1 second split results in the following view below.
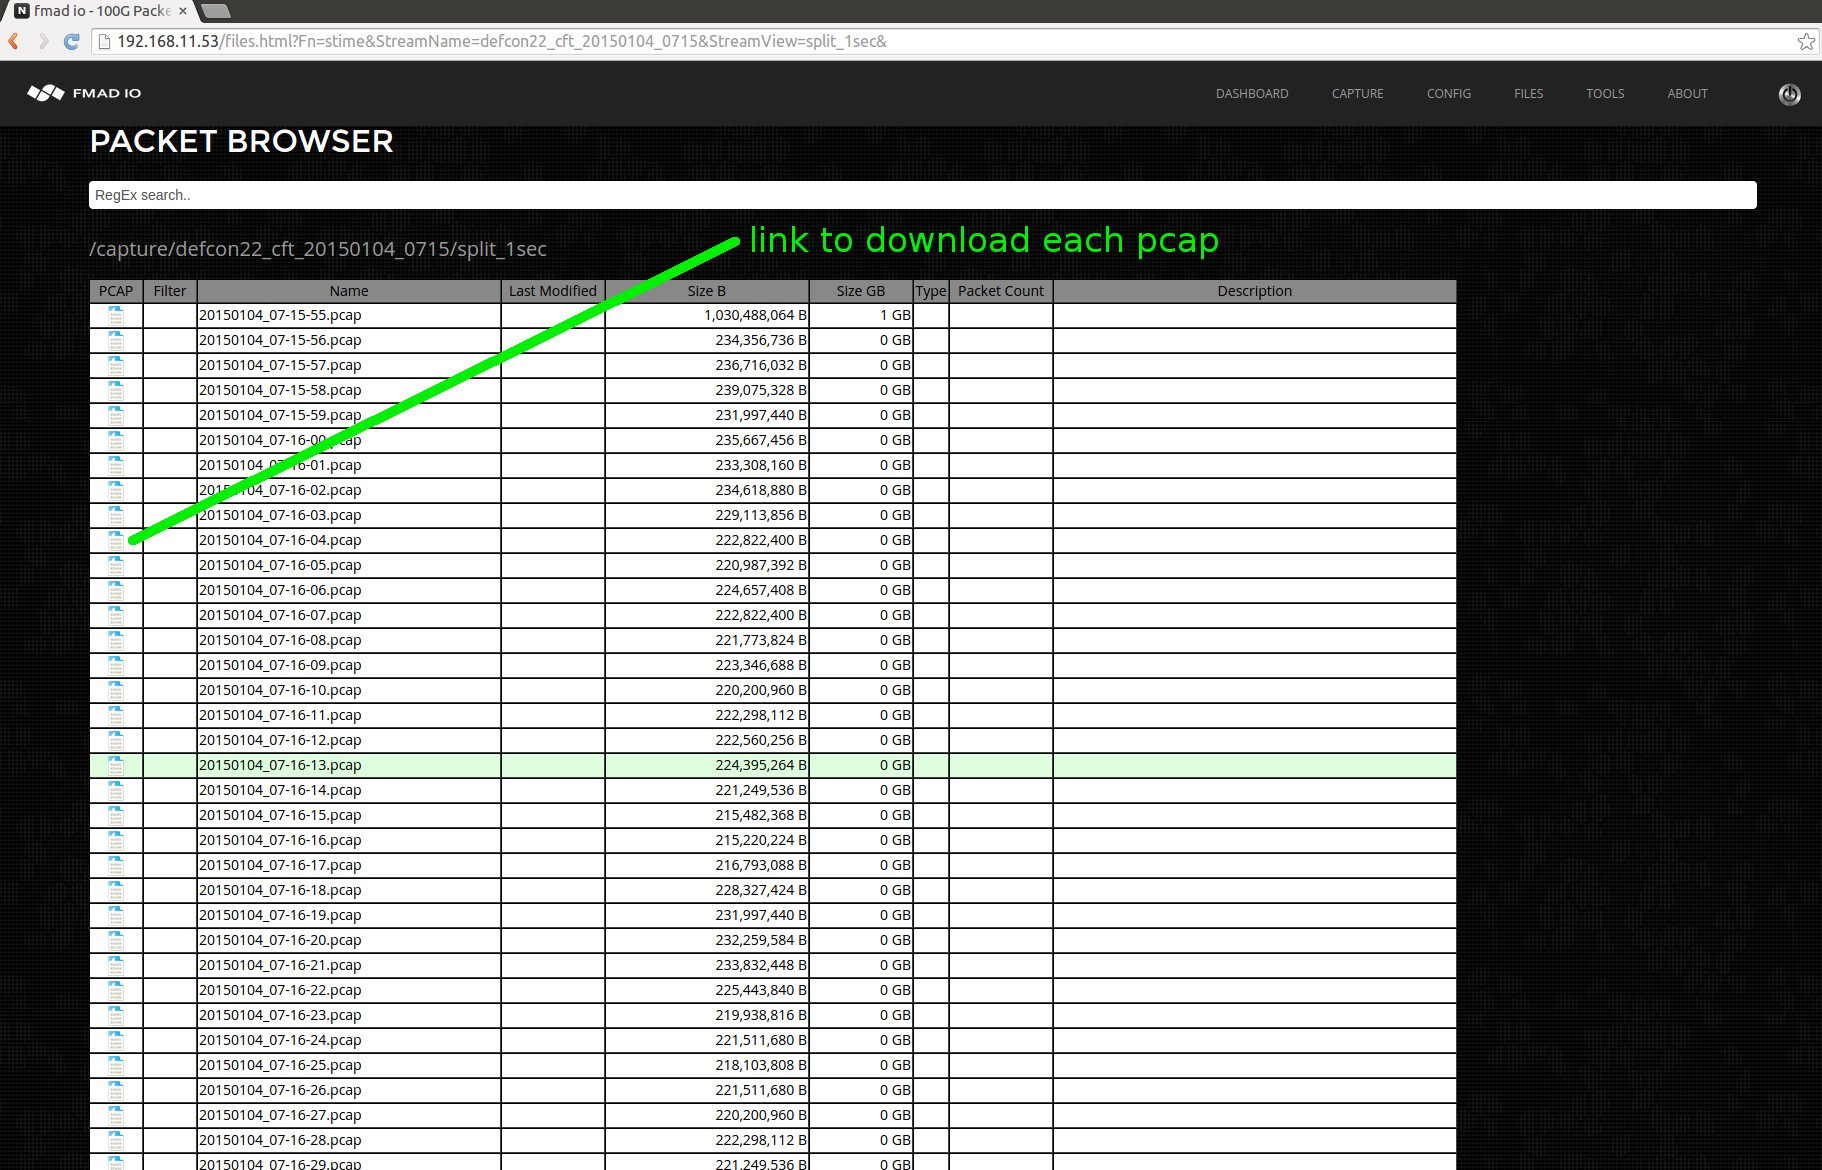
To download a specific file click on the Wireshark PCAP icon, or copy the URL and CURL it.
THE FILTER ENGINE
In the top level stream/file view we saw earlier a filter button which brings the following screen below. This is the onboard filtering engine. In this example we use the most hostile network traffic known to man (or machine) which is .... DEFCON CTF tournament traffic. This is a Capture-The-Flag competition by whitehat, blackhat, cathatz to hack the competitors machines... all out war as far as "cyber" goes and excellent traffic for testing network capture systems and packet decoders.

Above is the top level view of the filter engine. Typically the first thing to do is run a preview of the stream without any filter rules to get an idea of whats actually in the capture. Clicking on the "generate preview" button results in the following display below. The filter engine usually runs at 45Gb-50Gb/sec so our tiny 20GB pcap finishes in about 10 seconds. With a 1TB PCAP will finish 7-Tuple and more processing in a few minutes!

Above picture shows results after processing has completed, displaying various histograms of the traffic. In this case we see most of the traffic is TCP, and mostly of the traffic on port 8888. For this example we`re going to extract all HTTP traffic by entering the following rule "tcp.port == 80" which creates 3 different filters, shown below

Then click preview button and the capture device will crunch for a little bit and return a new histogram as shown below.

Its easy to notice the histogram has dramatically changed by the addition of the filter. Further more we`ve reduced the amount of capture from 20GB to a tiny 71MB. From here we click the download icon which pushes our minuscule 71MB worth of (defcon http 0-dayz) packet data to a local machine pcap file. Then fire up wireshark and start digging!
FINAL WORDS
That's a quick tour of the system. Its simple to setup, surgically slice and filter all packets before transferring to a local machine. There is alot more to the system but we have covered plenty for today.